

Morro Bay Infographic
CLIENT:
Morro Bay National Estuary Program
PROJECT:
Art direction, illustration and design for an infographic which was used to educate the community about water management concerns in the Morro Bay area of California.
TOOLS:
Adobe Illustrator

MBNEP Land Management Graphics
CLIENT:
Morro Bay National Estuary Program
PROJECT:
Provide art direction, data visualization, and illustration to communicate a variety of land management challenges in and around the Morro Bay Estuary. These graphics were used in reports and presentations.
TOOLS:
Adobe Illustrator

The Serpent and the Butterfly
CLIENT:
Dr. Ben Reebs
PROJECT
These data visualization spot illustrations were created for a medical book. They represent different healing techniques and info about the healing process.
The book is available on Amazon.
TOOLS:
Adobe Illustrator

Readers 2 Leaders Appeal Letter
CLIENT:
Readers 2 Leaders
PROJECT:
Provide art direction, illustration and layout design for a printed appeal letter. The focus of this asset was to raise funds for R2L’s new home and reading room. I created isometric illustrations representing different donor space opportunities and created a hierarchy of text using design elements and typography. The room graphics were created for reuse in mind—they can be used for social and web applications. The outreach was 850 potential donors.
You can view the complete project here.
TOOLS:
Adobe Illustrator, Photoshop, and InDesign

Sole Train Report
CLIENT:
SEED Impact
PROJECT:
Provide art direction, data visualization, illustrations, and page layout for a report that conveys impact reporting for the nonprofit, Sole Train. Sole Train uses running as a means to uplift and provide skills to underserved youth.
TOOLS:
Adobe Illustrator and InDesign

PPCW Annual Report
CLIENT:
PROJECT:
Provide art direction, data visualization, illustration and page layout for a 6 page digital report. The final report was made available to viewers as a PDF on the PPCW website.
TOOLS:
Adobe Photoshop and Illustrator
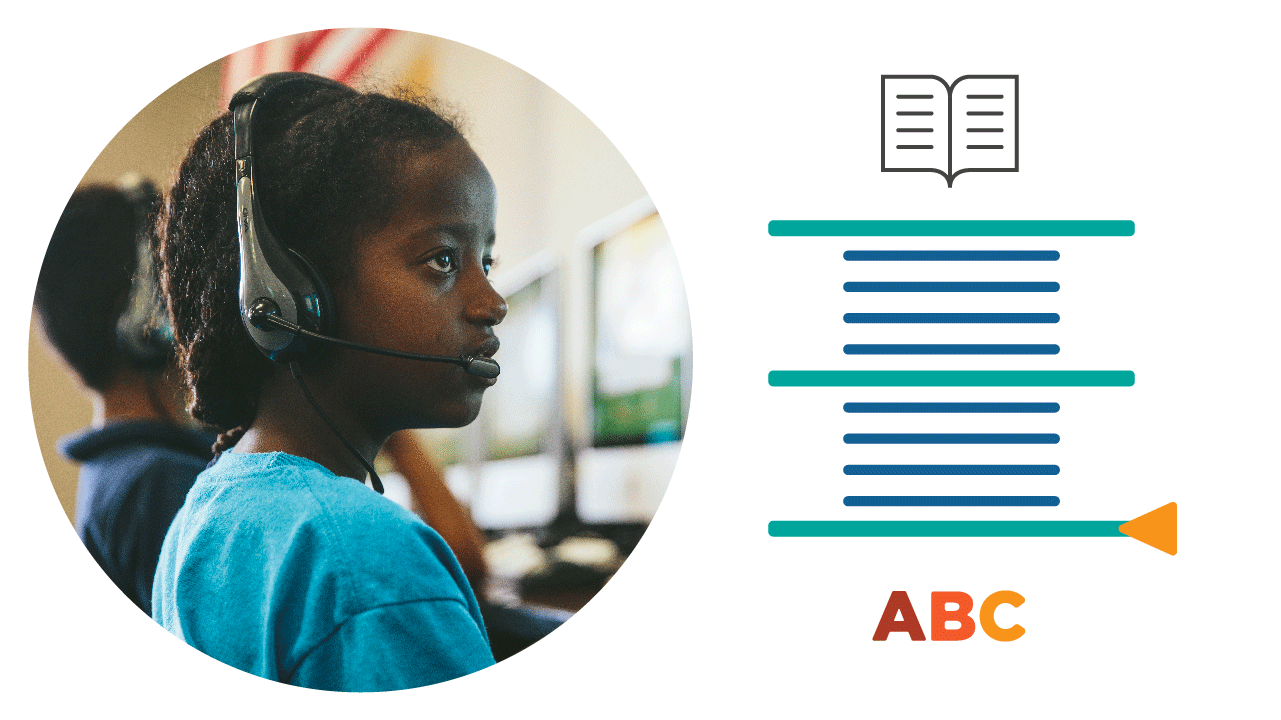


NWEA Explainer Graphics
PROJECT:
Create a collection of animated gifs to support online learning courses.
TOOLS:
Adobe Photoshop, Illustrator, and After Effects